Clarity over
intuition.
Zybit reads how customers move through your product — every click, every drop-off — and ranks what to fix by revenue impact.
Every finding ships with the evidence trail and a dollar estimate. No opinions. No generic checklists.
Friction is already in your data.
Dead-end sessions, rage taps, missed CTAs — the events tell you exactly where customers stall.
Zybit reads the signal and turns it into a ranked, defensible action list.
Ship what moves the metric.
Findings are ordered by estimated revenue impact, not severity score or gut feel.
Every prescription carries the evidence trail — defensible in standup, in the roadmap review, in the board deck.
Built on behavior.
Behavior in. Ranked, explainable priorities out.
Your data decides what ships — not opinions, not redesigns, not benchmarks.
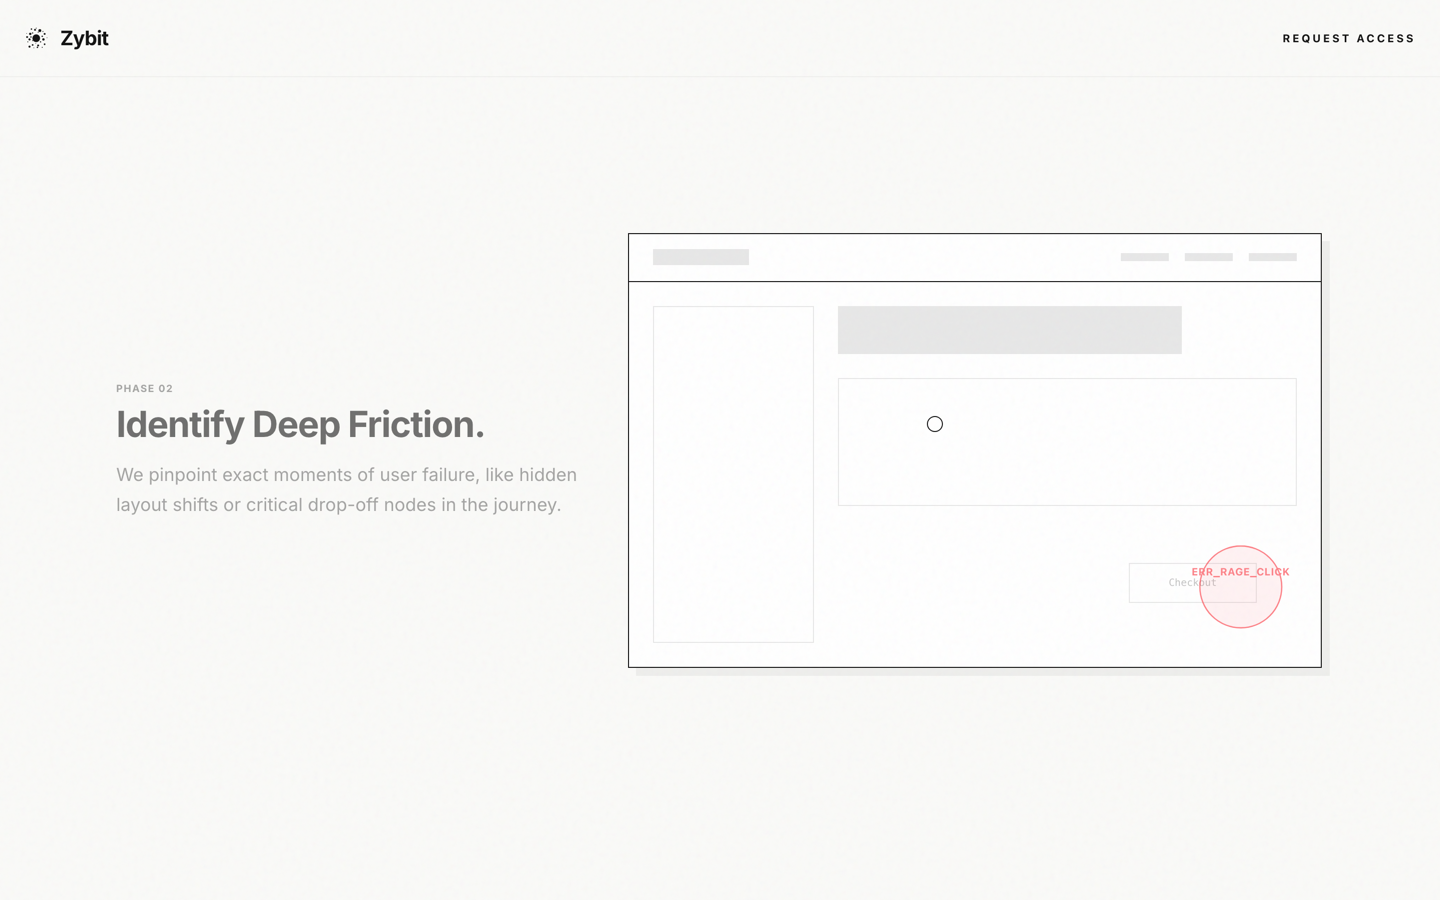
Zybit maps rage-click density to the exact element during analysis — before the receipt is issued.
Every finding ships with traceable evidence. No invented numbers.
See the four highest-impact fixes on your site.
Submit your URL and a work email. Zybit crawls the site, runs 13 friction rules, and emails the report — four ranked findings, evidence trail, estimated revenue impact.